Moro Chute HSR Model - Additional Test Results
Replication at High Flow
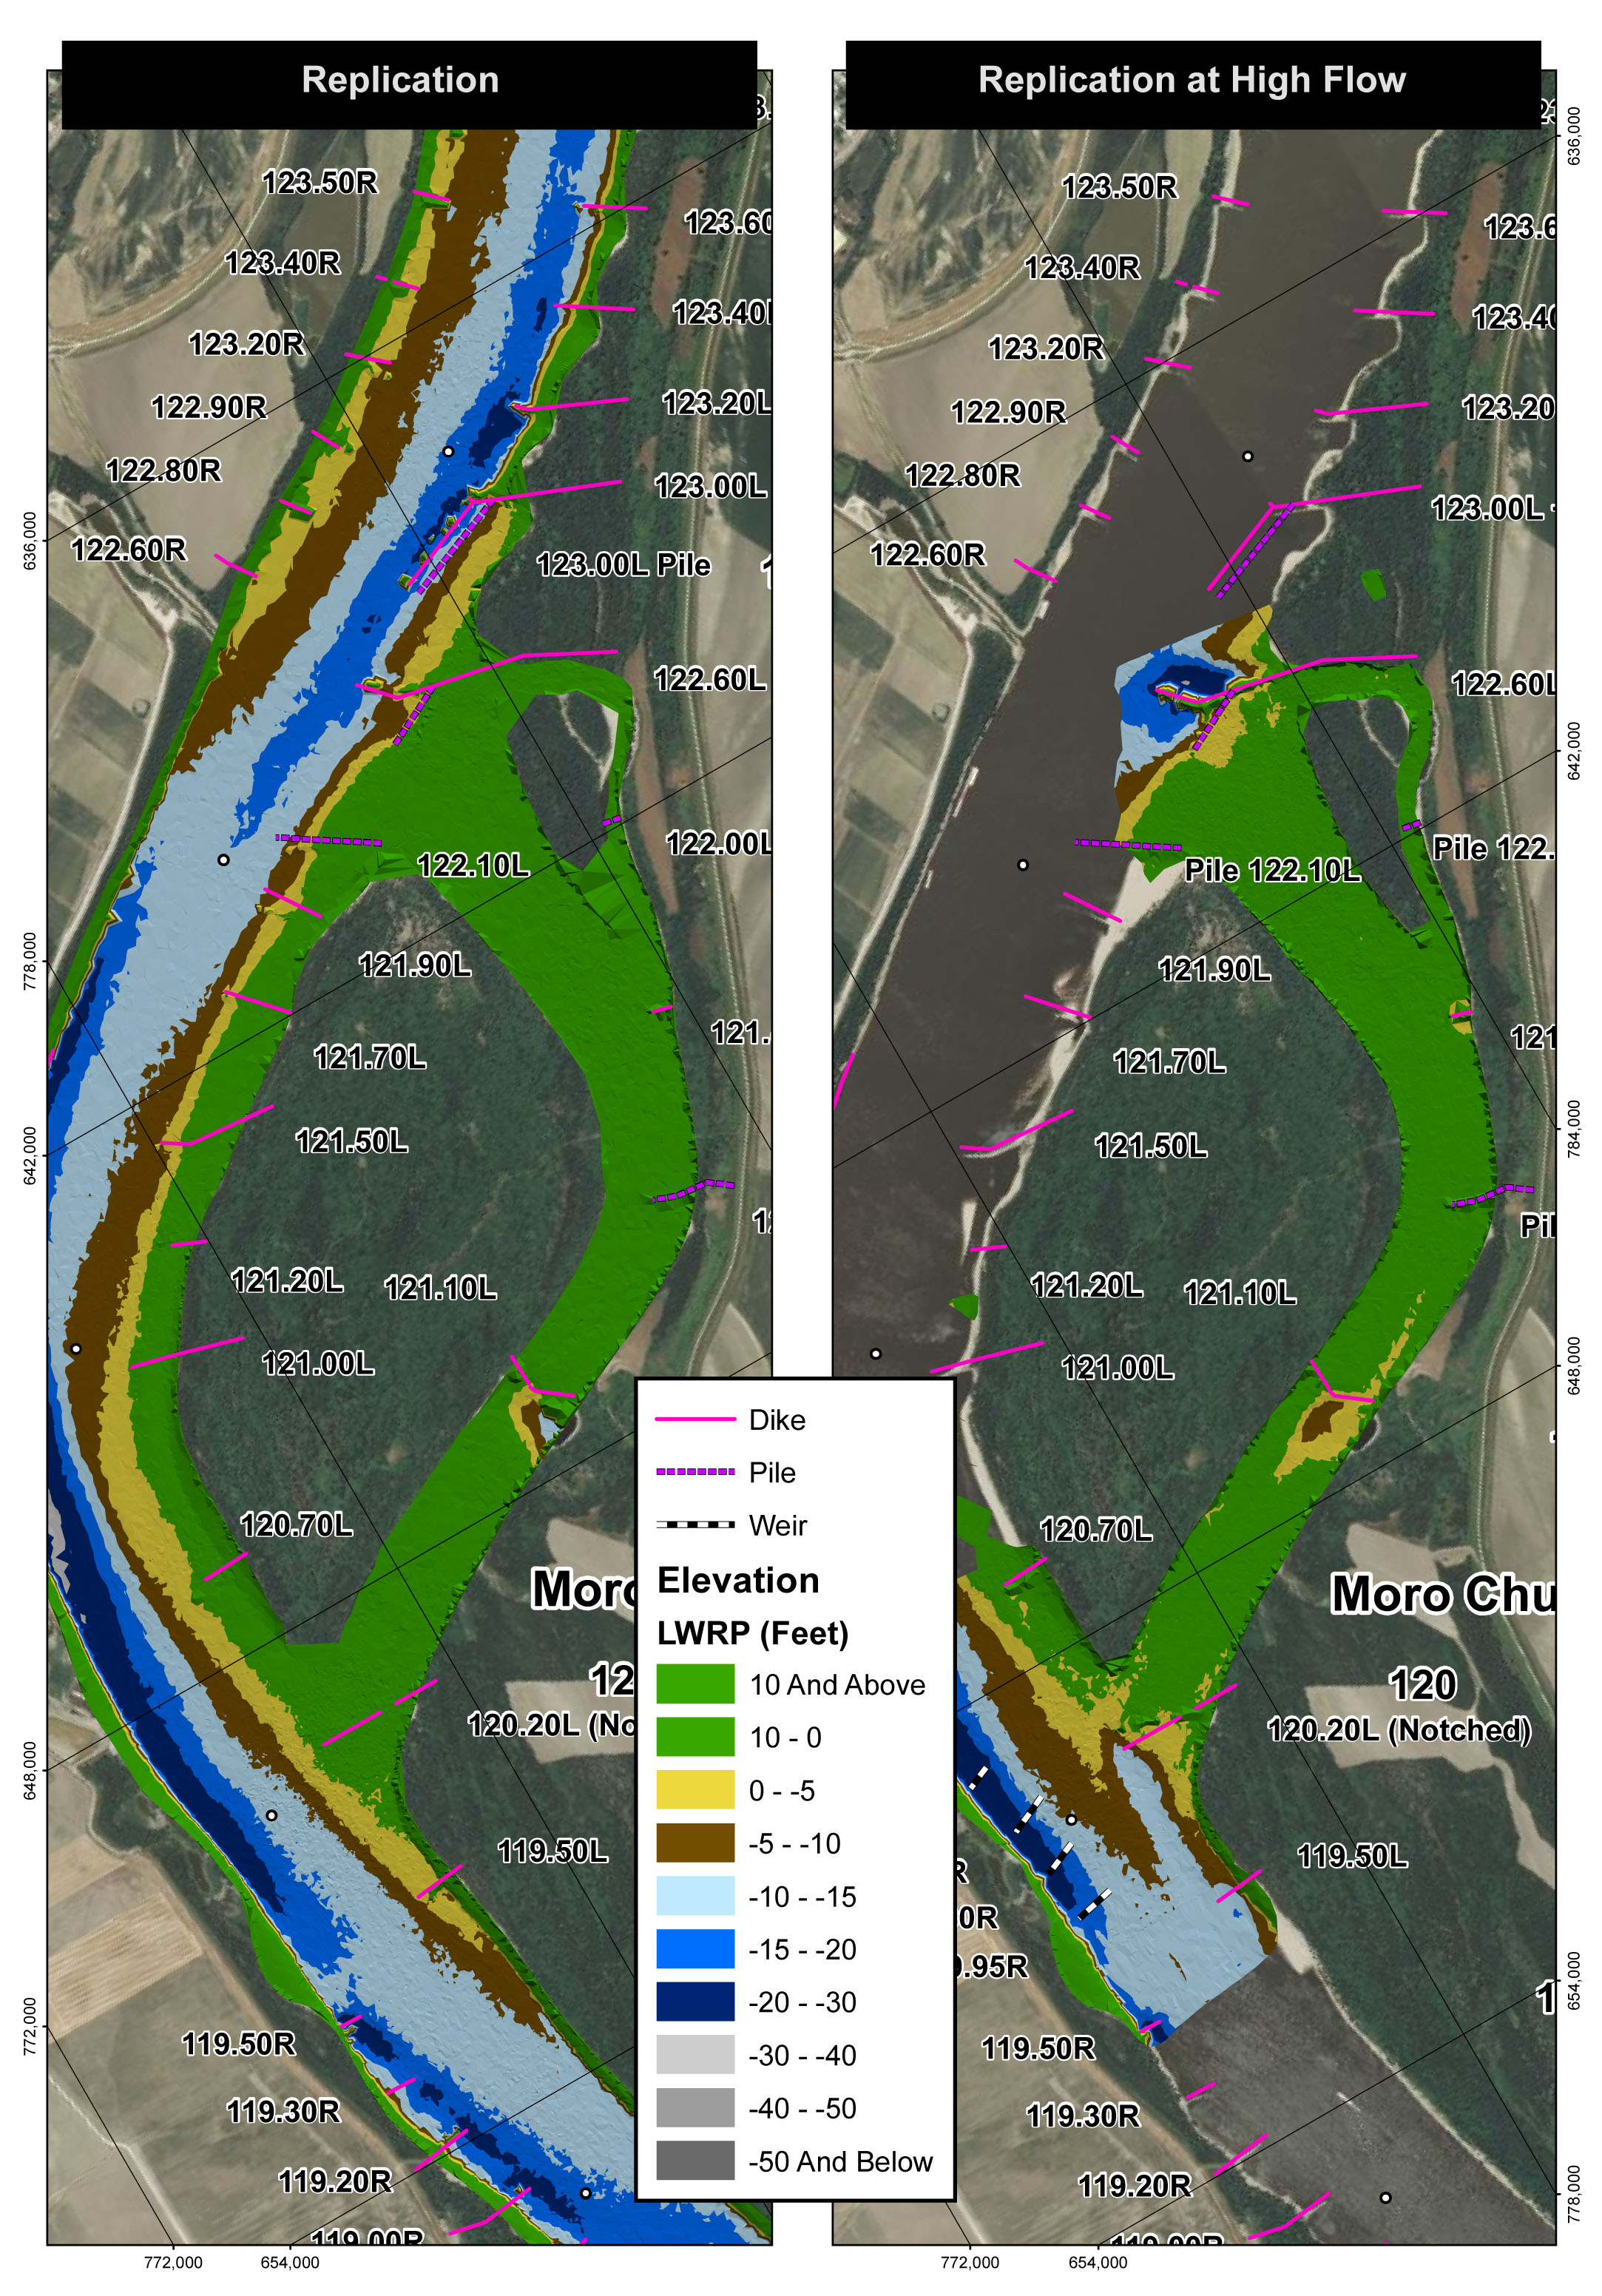
The replication test was run at a high flow rate to simulate high energy flood conditions during a typical flood. At the sustained high flow, the scour hole downstream of the closure Dike 121.10L developed. No sediment transport in the side channel was observed during this condition. See Figure 1 below for more details.

Figure 1: Replication vs. Replication at High Energy Flood Flow Condition
Replication = 1.15 GPM
Replication at High Flow = 1.80
All Dike Structures at +15 Feet LWRP
All Pile Dike Structures at +10 Feet LWRP
Test 1
The side channels were manually excavated between 0 and -5 feet LWRP (yellow on the color table). Sustained high flow was introduced to the model. See Figure 2 below for results.

Figure 2: Test 1 - Excavate Side Channel to 0 to -5 Feet LWRP
The primary and secondary side channels experienced immediate and rapid deposition to the original elevation of the replication condition. Deposition wavefront extended down to the closure dike. Eventually no sediment transport was observed.
Test 2
The side channels were manually excavated between -10 and -15 feet LWRP (light blue on the color table). Sustained high flow was introduced to the model. See Figure 3 below for results.

Figure 3: Test 2 - Excavate Side Channel to -10 to -15 Feet LWRP
The primary and secondary side channels experienced immediate and rapid deposition to the original elevation of the replication condition. Deposition wavefront extended down to the notched dike (Dike 120.20L). Scour occurred at Dike 121.80L and Pile Dike 121.60L. Eventually no sediment transport was observed.
Test 3
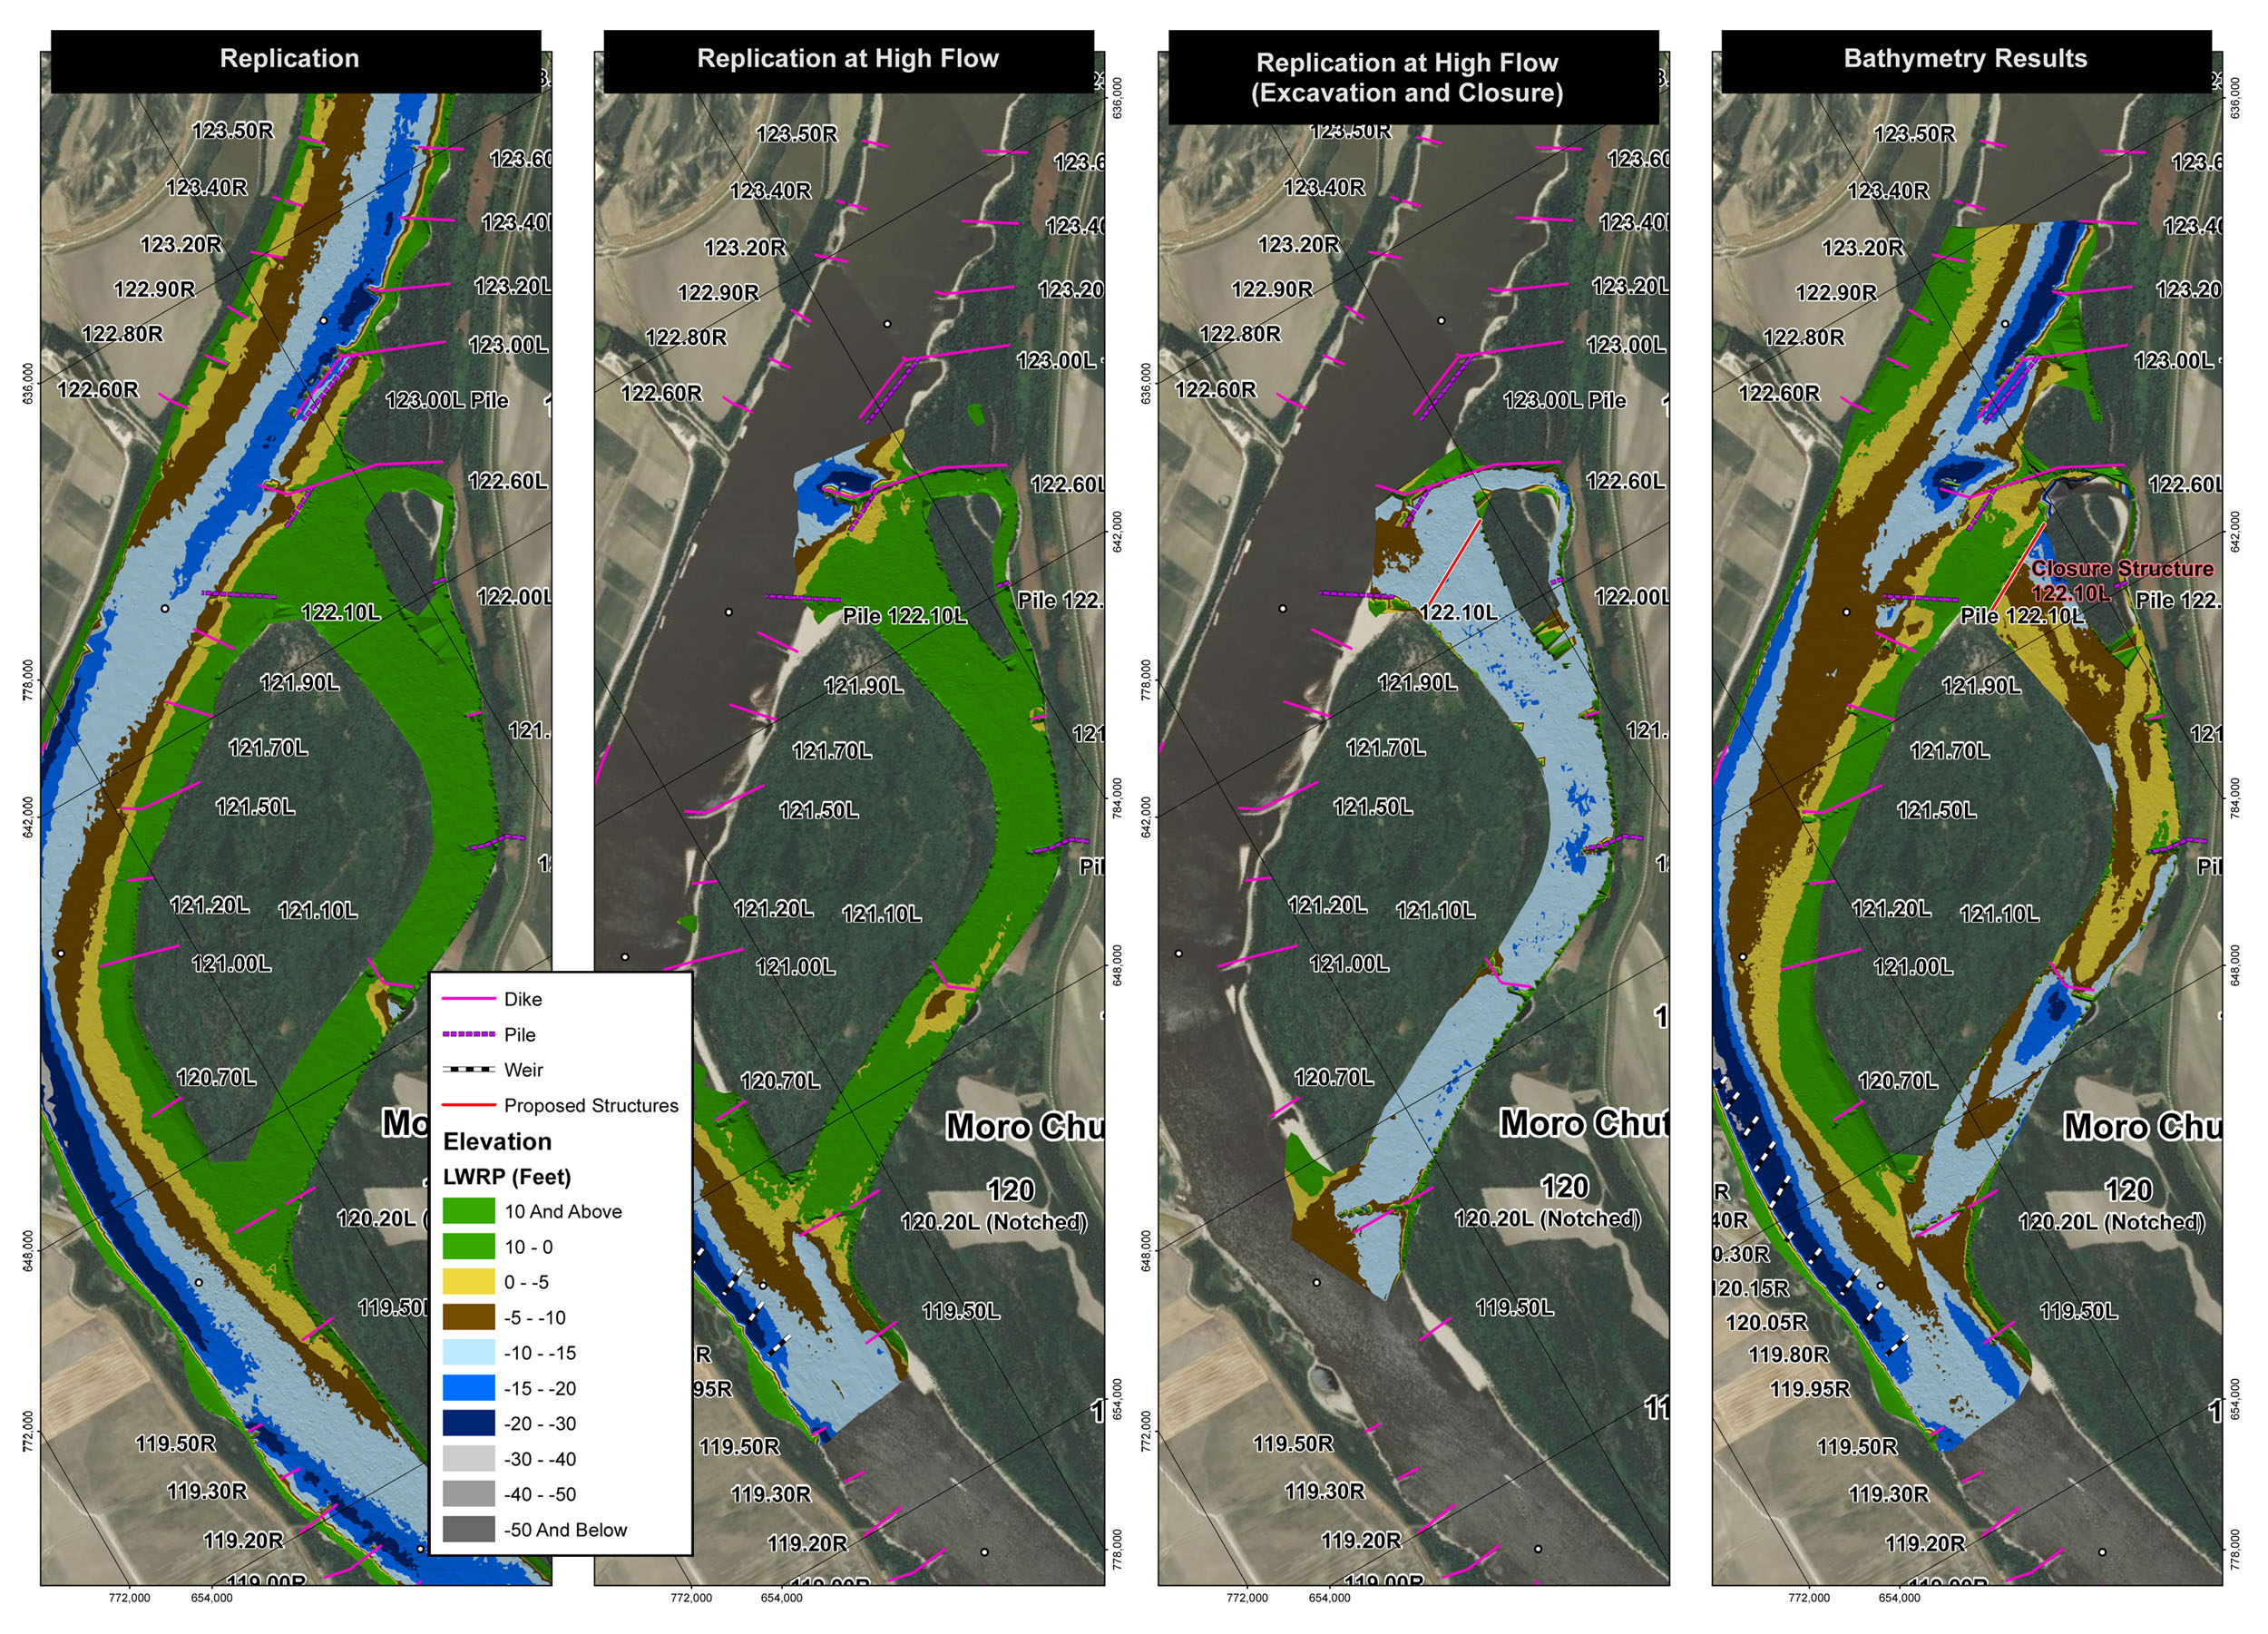
The side channels were manually excavated between -10 and -15 feet LWRP (light blue on the color table) and a new closure structure (+15 feet LWRP) installed at the entrance to the secondary side channel. Sustained high flow was introduced to the model. See Figure 4 below for results.

Figure 4: Test 3 - Excavation Side Channels and Closure Structure
The primary and secondary side channels experienced sediment deposition at the entrances.Sedimentation occurred downstream from the closure structure to Dike 120.20L. A scour hole formed downstream from Dike 121.10L. Eventually no sediment transport was observed in all side channels.
Test 4
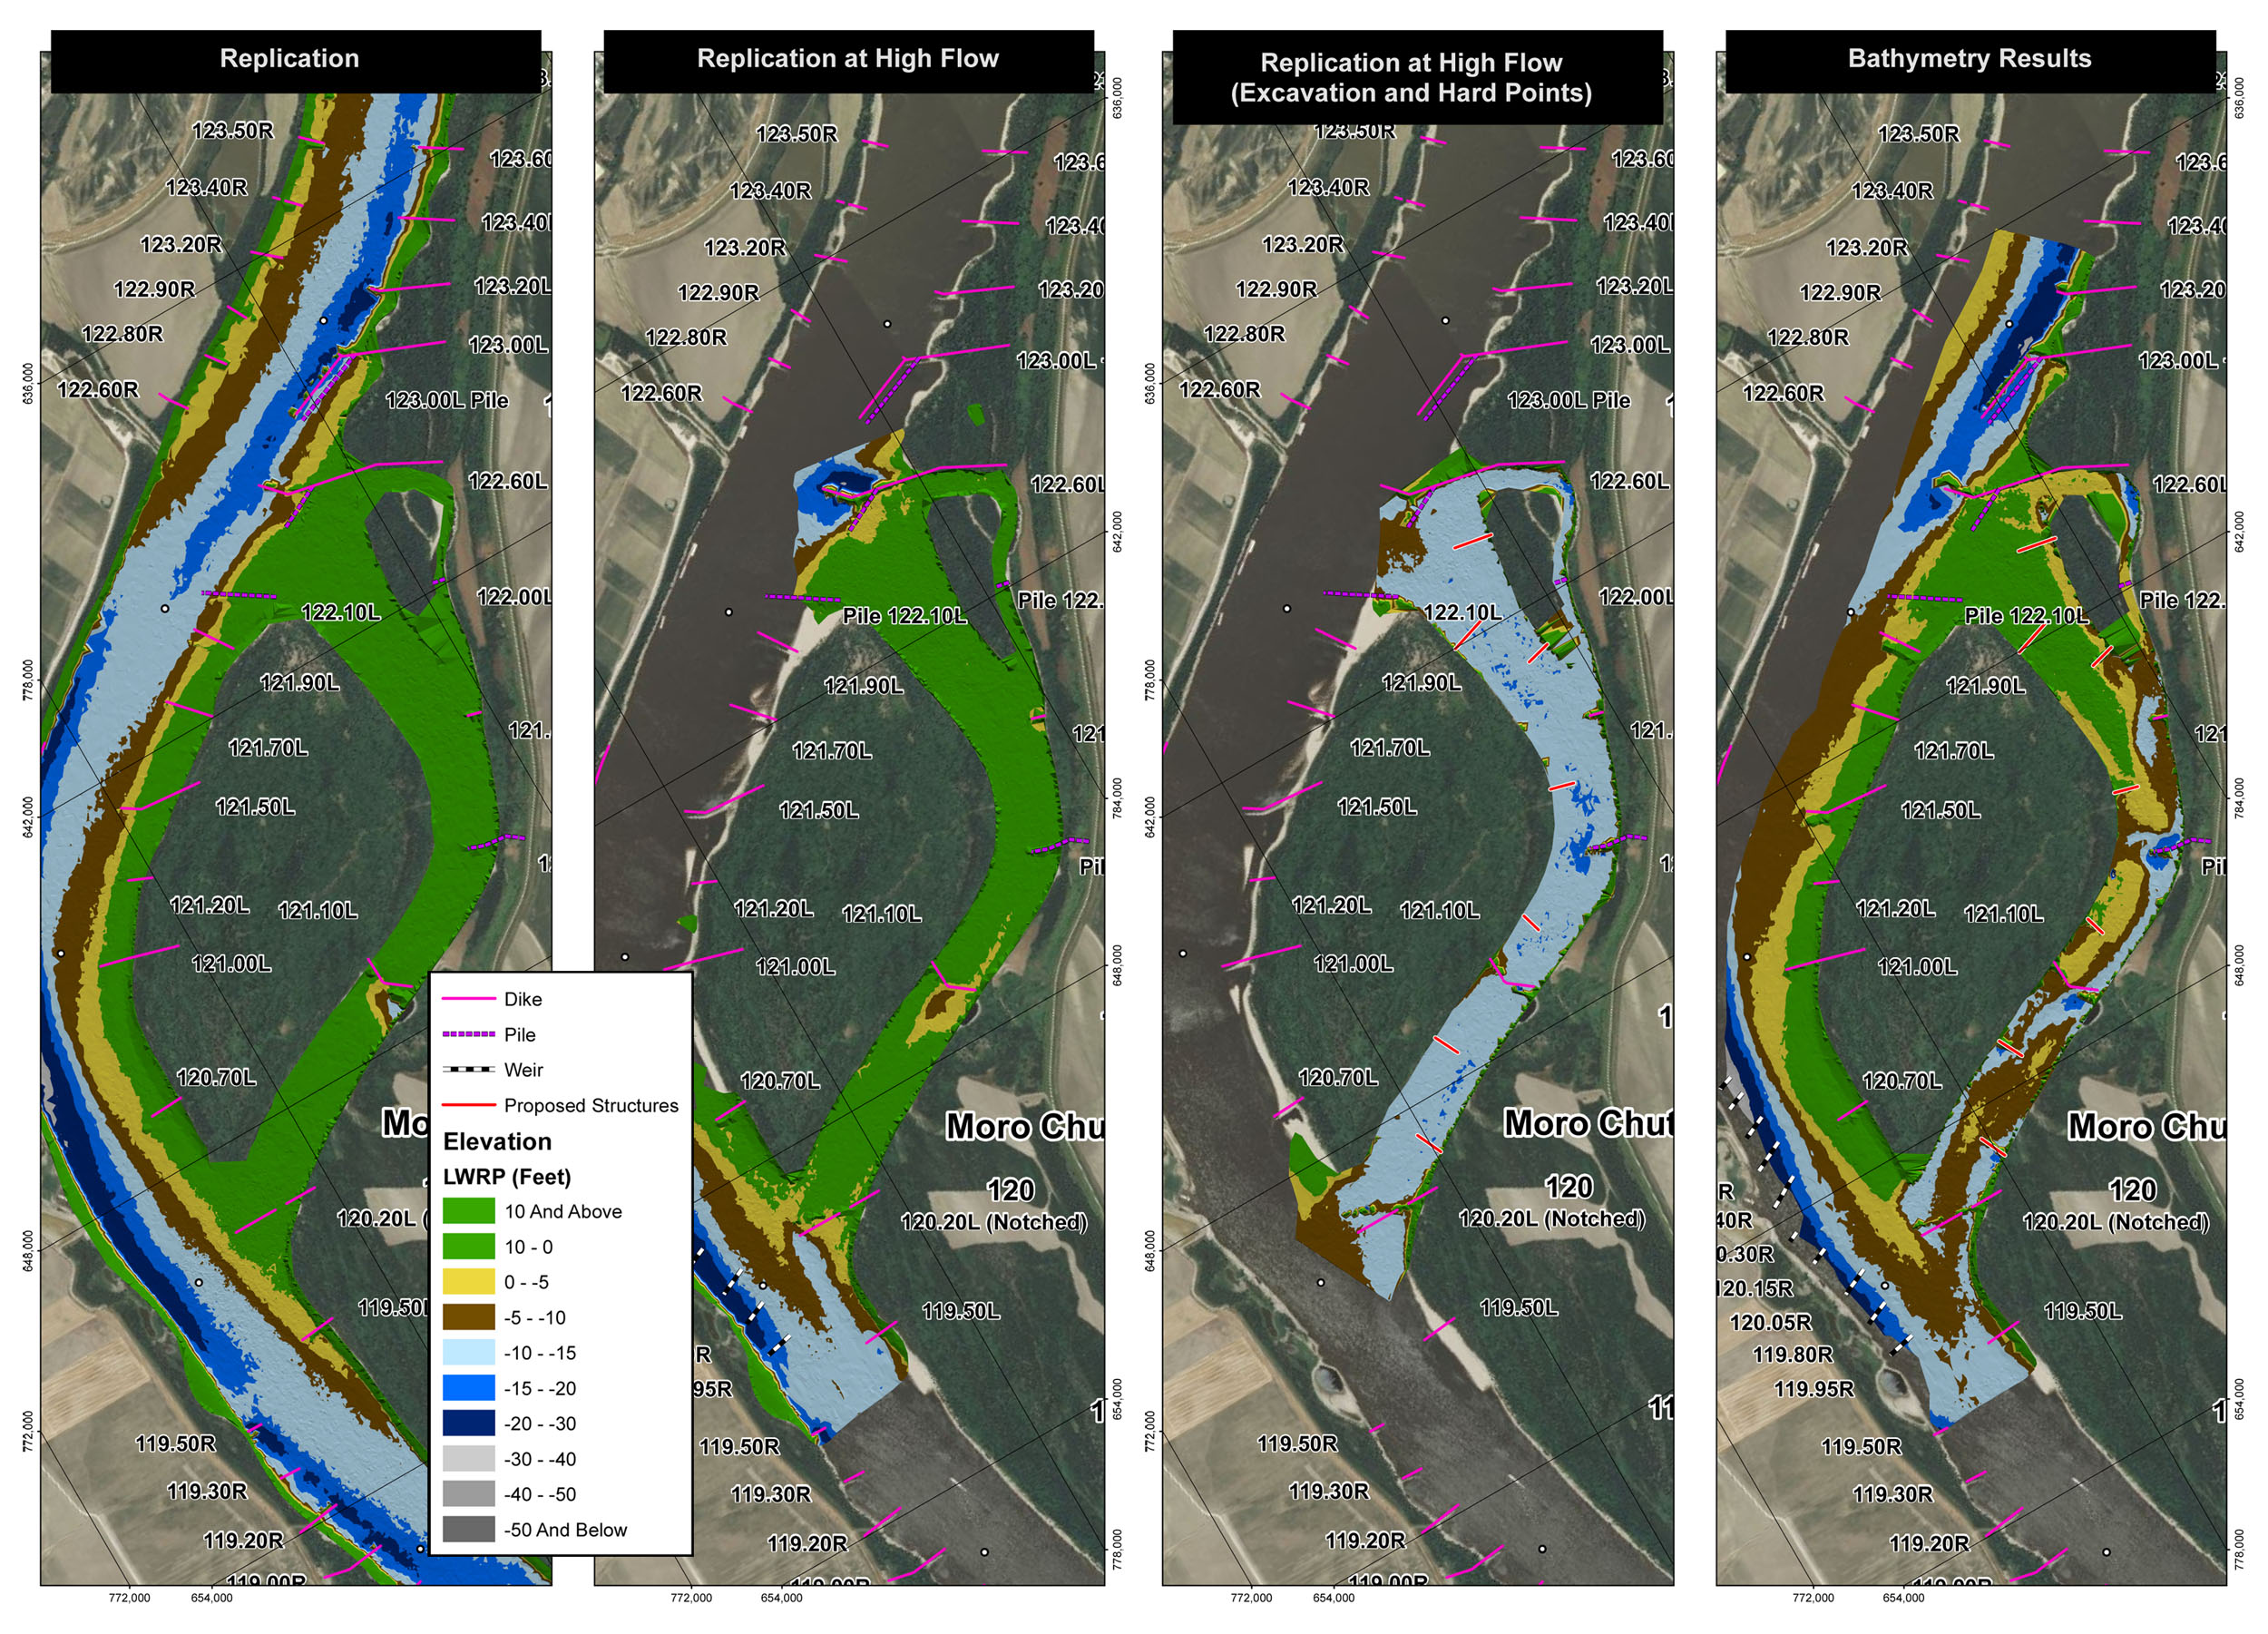
The side channels were manually excavated between -10 and -15 feet LWRP (light blue on the color table) and new alternative hard points (+15 feet LWRP) installed in the secondary and main side channels. Sustained high flow was introduced to the model. See Figure 5 below for results.

Figure 5: Test 4 - Excavation of Side Channels and Hard Points
The primary and secondary side channels experienced sediment deposition at the entrances. The channel meandered along the main side channel and created scour holes off the hard points. Eventually no sediment transport was observed in all channels.
Test 5
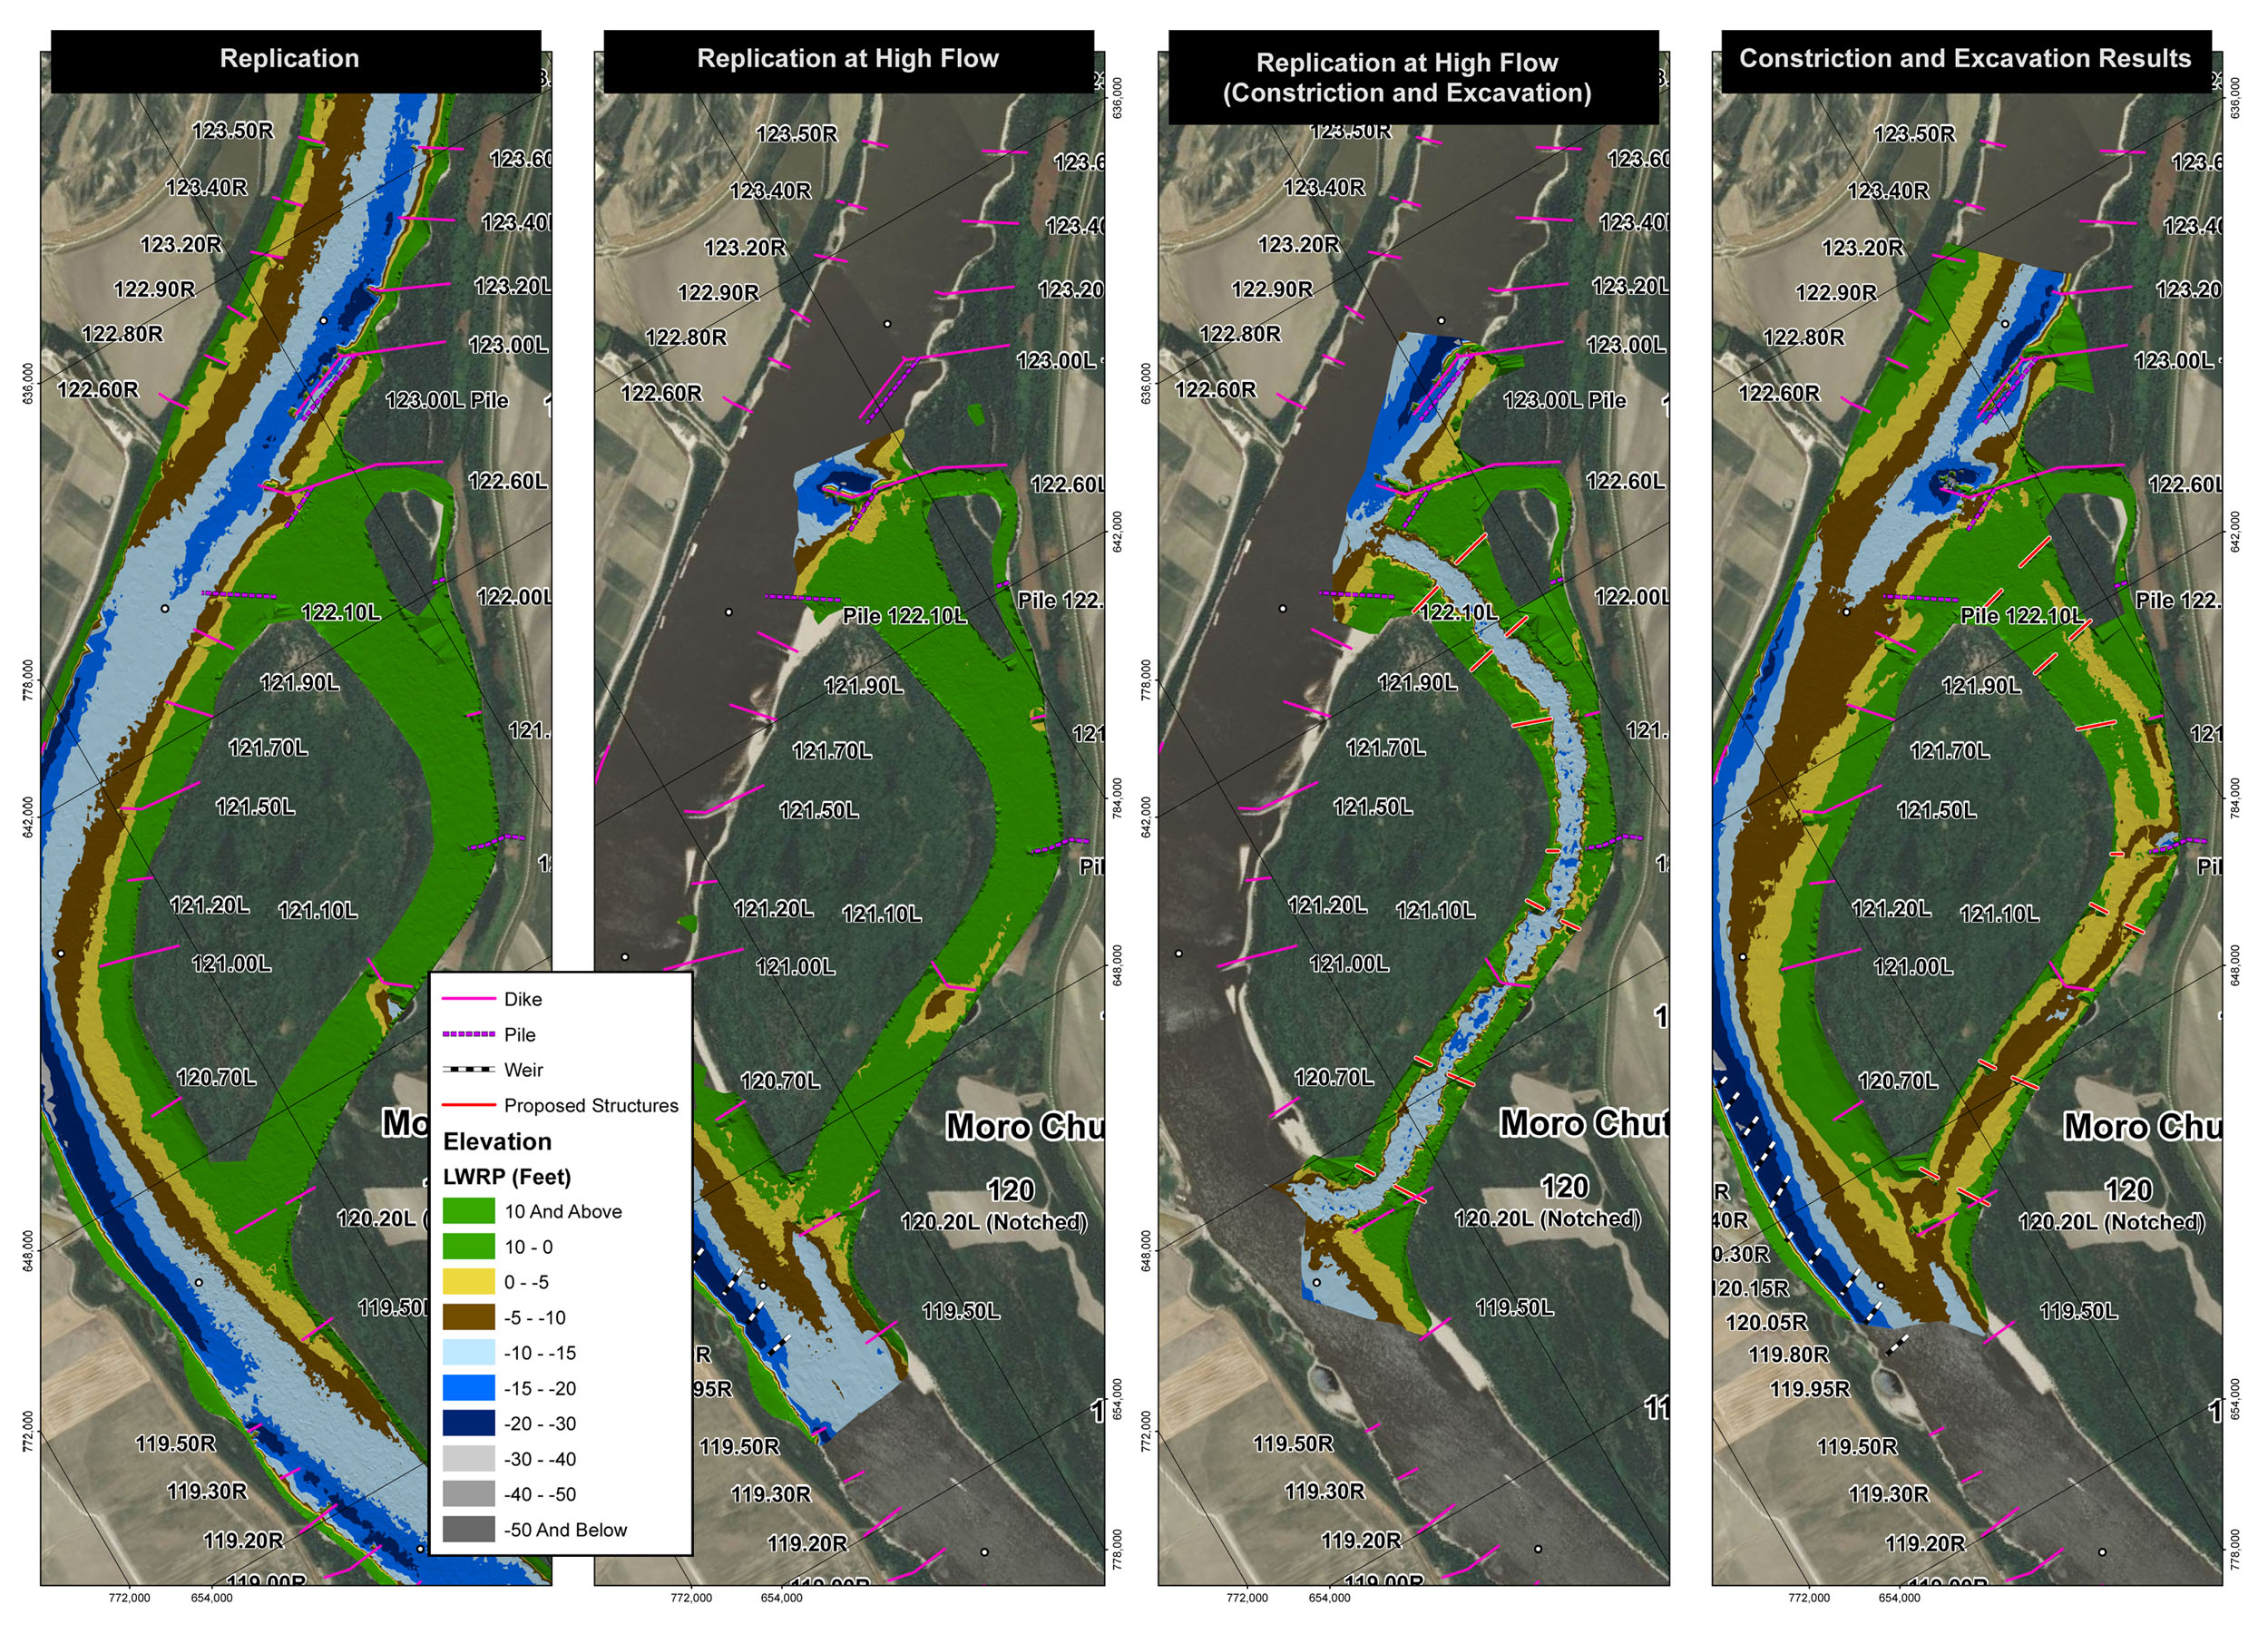
The secondary and main side channels were constricted (approximately 350 feet width) using dikes and were manually excavated between -10 to -15 feet LWRP (light blue on the color table). Sustained high flow was introduced to the model. See Figure 6 below for results.

Figure 6: Test 5 - Excavation and Constriction of Secondary Side Channel
The secondary side channel experienced sediment deposition at the entrance. No bathymetric changes occurred in the primary side channel. The secondary and main side channels experienced depostion. Eventually no sediment transport was observed in all side channels.
Flow Visualization
Below is the link to the flow visualization of Test 2.
